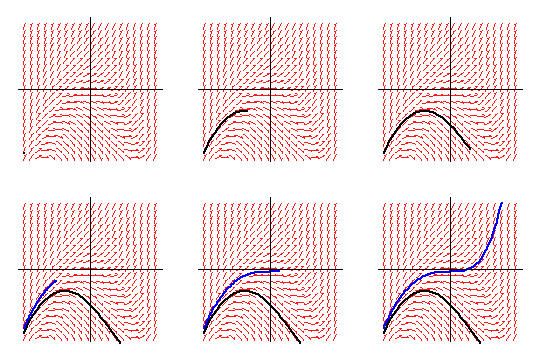
Maple 8 code:
with(DEtools):with(plots):
plotsetup(gif, plotoptions=`transparent=true,
   width=180, height=180`, plotoutput=`slope1.gif`):
P:=dfieldplot(diff(y(x),x)=y(x)+x^2,y(x),
   x=-2..2, y=-2..2, thickness=1):
f:=x->-x^2*exp(-x)-2*x*exp(-x)-2*exp(-x)+1;
g:=x->exp(x)*f(x);
Q1:=animatecurve(g(x),x=-2..2, color=black,
   thickness=2, frames=50, xtickmarks=0, ytickmarks=0):
display({P,Q1});
plotsetup(gif, plotoptions=`transparent=true,
   width=180,height=180`, plotoutput=`slope2.gif`):
R:=plot(g(x), x=-2..2, color=black, thickness=2,
   xtickmarks=0, ytickmarks=0):
g1:=x->exp(x)*(f(x)+1);
Q2:=animatecurve(g1(x),x=-2..2, color=blue,
   thickness=2, frames=50, xtickmarks=0, ytickmarks=0):
display({P,R,Q2});
plotsetup(default):
|
 |
