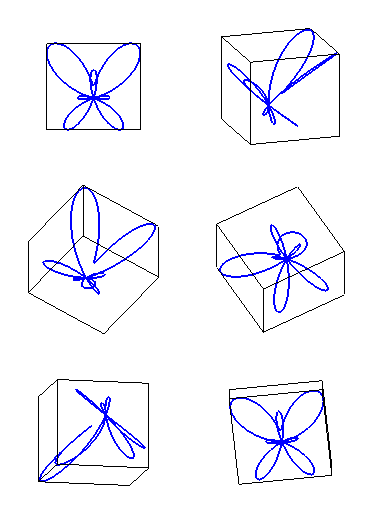
Maple 8 code:
with(plots):
f:=t->exp(cos(t))-2*cos(4*t)+sin(t/12)^5:
pic := n ->
   [spacecurve([f(t)*cos(t),f(t)*sin(t),f(t)/2],
      t=-Pi/2..3*Pi/2, color=blue, thickness=2,
      numpoints=100, axes=boxed, tickmarks=[0,0,0],
      orientation=[180+6*n,6*n])]:
display(seq(pic(n),n=0..59),insequence=true);
|
 |
Comments:
- As with the other rotating objects, we capture a Maple 3-D plot
structure at each of a number of viewing angles, and then display them in
sequence.
- In order to generate a complete rotation, we vary both theta and phi
through 360 degrees.
- To avoid a "chunky" look to the animation, we have
generated a large number of frames, which results in a large file.
Even after optimizing the GIF in an animation editor, the file is still
around 70K bytes.
- Since the first frame is displayed for several seconds before going
on to the later frames, the viewer's web browser may be able to load a significant
portion of the image before it is actually needed. This may help to
alleviate pauses during the initial cycle of the animation.
|
|
